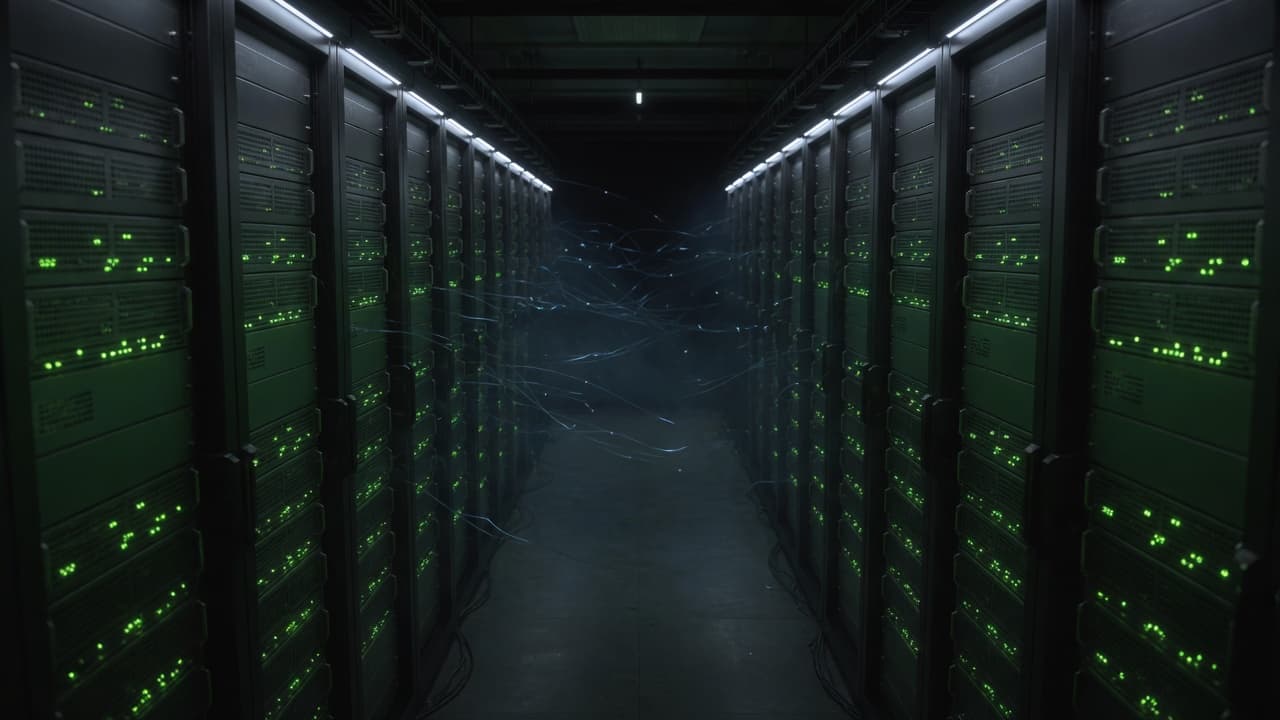
This illustrative example showcases an industrial IoT fleet telemetry and predictive maintenance dashboard designed by Canvas Developers to demonstrate our engineering capabilities for distributed hardware networks. As modern equipment manufacturers and logistics operators manage hundreds of connected assets across remote job sites, robust IoT telemetry dashboard development becomes essential for sustaining equipment reliability and operational visibility.
Engineered to withstand sporadic field connectivity, the platform architecture ingests high-frequency sensor streams, flags time-series anomalies, and coordinates automated maintenance workflows within an integrated operational portal.
What Are the Core Specifications of This IoT Telemetry Dashboard Concept?
Sector Focus: Heavy Equipment Manufacturing and Logistics Fleets
Heavy equipment manufacturers and commercial fleet logistics providers operate hundreds of connected assets across distributed geographical environments. This illustrative example addresses the operational requirements of remote industrial machinery, where unpredictable edge connectivity demands robust IoT telemetry dashboard development to monitor asset health without data loss.
Target Technology Stack, Ingestion Protocols, and Cloud Infrastructure
The industrial IoT dashboard architecture combines a resilient MQTT ingestion broker with an optimized time-series database cluster and a responsive web portal. Containerized microservices deployed on scalable cloud infrastructure parse vibration, temperature, and fuel telemetry, ensuring high-throughput processing while maintaining low latency across concurrent fleet data streams.
What Operational Constraints and Connectivity Challenges Defined the Brief?
Handling High-Frequency Sensor Streams Over Sporadic Remote Connections
Field machinery operating in remote mining, construction, and freight transit corridors frequently encounters cellular blackouts and packet jitter. For industrial fleet telemetry monitoring software operating under these constraints, network resilience is paramount. Telemetry edge gateways record high-frequency sensor readings into local non-volatile ring buffers, applying payload compression to preserve memory before transmitting backpressure-controlled bursts when communication links stabilize.
Establishing Reliable Telemetry Pipelines for Field Machinery
Transmitting continuous telemetry streams without data corruption requires deterministic message processing. When field machinery reconnects after prolonged dropouts, the real time iot sensor data dashboard validates queued batches, deduplicating incoming records and reconciling out-of-order timestamps before storage. This structured ingestion ensures that telemetry gaps are cleanly resolved without distorting historical wear patterns or generating inaccurate operational alerts.
How Does Human-Led Engineering Balance AI Acceleration in IoT Development?
Accelerating Timeseries Visualizations and Alert Configuration with AI
Modern AI coding agents significantly accelerate front-end delivery timelines for data-heavy enterprise applications. Directed by engineers, AI tools quickly scaffold responsive telemetry views, alert threshold configuration panels, and interactive widgets for timeseries iot data visualization. This workflow converts user interface specifications into clean, typed UI components in a fraction of standard development time.
Architecting Scalable MQTT Brokers and Time-Series Indexing by Senior Engineers
While generative tools excel at standard interface scaffolding, distributed edge infrastructure requires deep systems expertise. Senior backend and DevOps engineers design the underlying architecture, configuring clustered MQTT brokers, connection session management, and optimized time-series database indexing. Experienced engineers structure storage partitions to sustain high-throughput concurrent writes without degraded query latency during asset health investigations.
Addressing AI Coding Limits in Edge Security, Data Integrity, and Ingestion Scale
AI tools often fail when managing complex edge security handshakes, cryptographic verification, and ingestion scale bottlenecks. In professional iot telemetry dashboard development, senior engineers conduct rigorous code reviews, resolve distributed concurrency edge cases, enforce strict data validation boundaries, and decide all production release gates to ensure absolute system reliability.
What Architectural Systems and Telemetry Features Were Engineered?
Real-Time MQTT Sensor Ingestion and Resilient Local Message Buffering
Connected sensors installed across machinery record continuous operational telemetry, including mechanical vibration, engine temperatures, and fuel levels. Within this industrial iot dashboard architecture, lightweight edge brokers enforce MQTT QoS protocols with local disk-backed message buffering. When field machinery encounters remote network dead zones, telemetry packets remain safely queued, preventing telemetry loss until stable wireless connectivity is re-established.
Timeseries Anomaly Threshold Detection and Automated Ticket Dispatch
Effective predictive maintenance platform engineering requires instantaneous detection when operational metrics drift beyond safe tolerance bands. The streaming pipeline continuously evaluates incoming metrics against configurable anomaly rules. When sensor streams detect sustained thermal spikes or abnormal harmonic vibrations, the platform automatically dispatches structured maintenance tickets with historical telemetry context to operational field teams.
Interactive Fleet Geolocation and Equipment Health Monitoring Views
The user interface provides a custom scada web dashboard development experience that unites live GPS fleet positioning with granular equipment health status. Operations coordinators track distributed assets across interactive regional maps, review aggregate uptime metrics, and inspect chronological component histories to coordinate preventive servicing before mechanical breakdowns occur.
What Operational Value Does This Telemetry Architecture Deliver?
Maintaining Telemetry Continuity Through Sporadic Field Connectivity
Deploying specialized fleet telemetry monitoring software ensures continuous operational visibility across challenging remote operating environments. By combining local gateway caching with deterministic synchronization on reconnection, the architecture guarantees unbroken diagnostic trails without packet loss, allowing engineering teams to audit past operating stresses with confidence.
Reducing Unplanned Machine Downtime with Early Anomaly Warnings
By translating continuous raw sensor streams into early actionable alerts, the real time iot sensor data dashboard flags thermal spikes, abnormal vibrations, and fuel deviations before catastrophic mechanical failures occur. Operations teams transition from costly reactive repairs to targeted, condition-based maintenance schedules, preserving machinery lifespans across demanding fleet cycles.
How Can Operations Teams Scope a Custom IoT Telemetry Platform?
Selecting Between Private Local AI and Cloud-Assisted Engineering Models
Organizations pursuing iot telemetry dashboard development choose between two models: Private / Local AI Engineering using isolated models in client infrastructure, or Claude Code / OpenAI Codex Engineering using commercial cloud tooling.
Initiating a Scoped Technical Assessment via Canvas Developers
Planning an industrial iot dashboard architecture begins with scoping ingestion throughput, brokers, and alerting. Engagements follow agreed milestones, rigorous QA, and handover led by senior engineers. Start with a scoped assessment via the contact form at https://www.canvasdevelopers.com/contact.