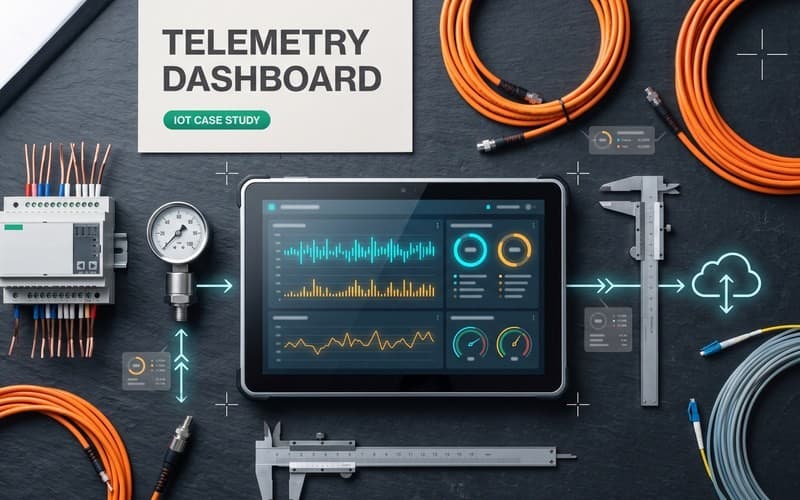
This illustrative example is a concept design by Canvas Developers demonstrating how engineering teams govern distributed automations. It is not delivered client work. Modern operations require a dedicated zapier integration dashboard to intercept asynchronous failure states, capture dropped payloads, and protect data integrity.
ZapFlow Monitor pairs an administrative dead-letter queue with real-time observability. By buffering failed webhooks and enabling targeted replays, teams resolve upstream schema drift before records are permanently lost.
What Is ZapFlow Monitor? Project at a Glance
ZapFlow Monitor acts as an operational intermediary between data providers, Zapier workflows, and destination databases. Conceived as an architecture for a dedicated zapier integration dashboard, the platform centralizes event capture across multi-step Zaps processing business-critical records. The console provides immediate visibility into webhook ingestion status, payload delivery health, and route saturation.
The stack pairs a Node.js ingestion gateway with PostgreSQL and a React administrative interface. While automated tools assist component scaffolding, Canvas Developers engineers govern event queue durability, database schemas, and secure authentication to ensure system resilience.
Why Do Distributed Zaps Require a Dedicated Dead-Letter Queue?
Automated SaaS workflows often suffer unrecoverable data loss during transient network partitions or downstream service outages. Default configurations retry only over brief intervals; as documented in Zapier webhook error handling specifications, delivery attempts with exponential backoff cease after roughly 25 minutes, permanently discarding unhandled events. Without an external zapier dead letter queue, unmonitored drop-offs create invisible accounting discrepancies and fulfillment gaps across integrated platforms.
Upstream schema drift exacerbates this operational fragility. When third-party APIs alter payload structures or omit required fields, downstream tasks fail silently. A dedicated zapier error tracking system intercepts malformed requests, isolates invalid payloads within persistent storage, and alerts maintainers before downstream data pipelines break.
How Does Hybrid AI Engineering Accelerate Dashboard Delivery?
Building internal observability portals often incurs significant front-end and infrastructure overhead. Canvas Developers accelerates development cycles by directing AI coding agents within an established harness to generate administrative views, responsive table filtering, and baseline API schemas, rapidly assembling a functional zapier monitoring tool.
However, automated code generation presents distinct technical limits: AI agents frequently miss concurrency race conditions, subtle authentication vulnerabilities, and database transaction edge cases. To ensure enterprise standards, experienced engineers oversee every layer of the system. Senior architects validate tenant data isolation, audit webhook signature verifications, and stress-test high-volume ingestion queues. Clients select either private, isolated model hosting or commercial AI tools, maintaining complete architectural control and code transparency throughout the build.
What Core Features Power the ZapFlow Health Dashboard?
ZapFlow Monitor combines three operational modules to diagnose upstream schema mismatches in real time without searching individual task history logs. First, automated payload inspection captures failed incoming events, comparing raw JSON structures against expected schema contracts. This visual diff highlights missing attributes, unexpected null values, and type discrepancies across every registered integration endpoint.
Second, the platform integrates a resilient webhook retry system for zapier built on Zapier CLI REST hook triggers. Operations teams can inspect quarantined events in the dead-letter queue, modify payload fields within the management console, and execute targeted replays to specific Zapier subscription endpoints. This controlled replay mechanism prevents duplicate executions across non-failing workflow steps while confirming that repaired payloads pass all destination validations.
Third, a custom zapier alert portal benchmarks latency and route performance across all active integrations. When round-trip response times degrade or endpoints return consecutive 5xx server errors, instant alerts notify engineering channels before workflow timeouts cascade.
What Operational Advantages Does Centralized Error Handling Deliver?
Debugging integration failures across enterprise automations typically forces engineers to audit hundreds of individual Zap task execution logs across fragmented accounts. This manual searching causes significant diagnostic latency during critical production incidents. Centralizing failure ingestion within a unified zapier error tracking system aggregates errors by route, payload structure, and HTTP status code, revealing recurring failure patterns instantly.
By transforming raw error logs into structured queue items, operational teams establish repeatable triage workflows for mission-critical pipelines. Automated deduplication prevents alert fatigue, while immutable payload archiving ensures end-to-end data auditability and regulatory governance across enterprise software ecosystems.
How Can You Commission a Custom Integration Dashboard?
Organizations seeking to protect critical automations can partner with Canvas Developers to design a custom zapier integration dashboard. Each engagement begins with structured technical scoping to define event ingestion volumes, endpoint topologies, and security boundaries.
Our senior engineers direct AI coding workflows through agreed milestones, rigorous testing, and handover. To evaluate your integration architecture, request a scoped assessment through the Canvas Developers contact form.