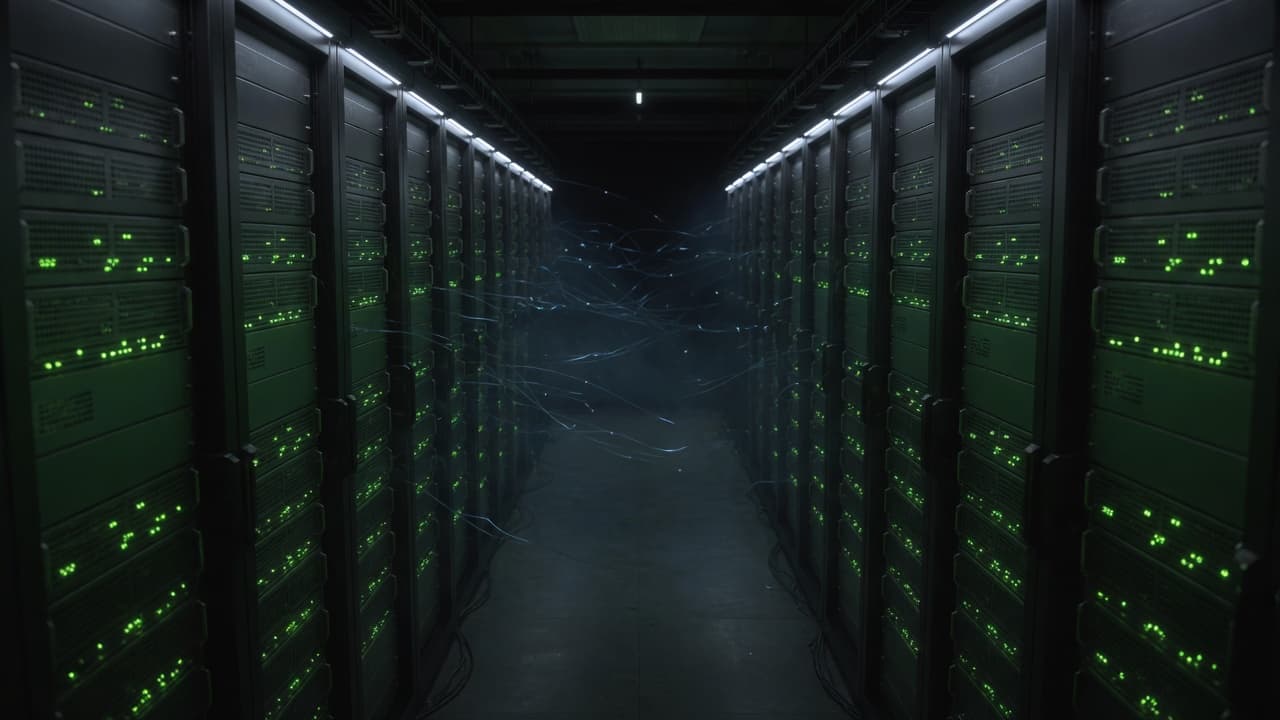
This illustrative case study examines how industrial engineering teams address unmonitored equipment drift through modern manufacturing telemetry dashboard software. In many production plants, critical run-time and temperature logs remain trapped within disconnected machine controllers, delaying maintenance until catastrophic assembly stoppages occur.
By deploying resilient IoT telemetry pipelines paired with web-based operational dashboards, manufacturers can unify distributed shop floor signals into live visibility. This scenario outlines the typical architectural challenges, edge data risks, and engineering workflows involved in turning raw hardware telemetry into proactive maintenance decisions.
Executive Summary: What Does an Industrial Telemetry Dashboard Deliver at a Glance?
Unifying Disparate Assembly Line Controllers into a Single Operations View
Industrial plants often operate diverse assembly units across disparate hardware controllers. When critical temperature logs remain isolated on local machines, leadership cannot spot wear before line stoppages occur. Purpose-built manufacturing telemetry dashboard software bridges these disconnected controllers into a unified console, consolidating machine states into clear supervisory streams.
Key Deliverables: Resilient Sensor Ingestion and Real-Time Web Telemetry
A resilient telemetry deployment delivers a fault-tolerant edge ingestion pipeline and a responsive browser dashboard. The ingestion layer reliably captures real time machine telemetry across noisy shop floor networks, buffering packets during dropouts. Concurrently, the web interface visualises operational thresholds and shift metrics, enabling supervisors to monitor equipment stability without proprietary desktop tools.
The Operational Challenge: Why Does Trapped Sensor Data Delay Critical Maintenance?
Telemetry Isolated in Localized Controller Storage Across Dozens of Units
In typical factory configurations, assembly lines rely on dozens of distinct machines equipped with individual programmable controllers. These local units record operational run-times, duty cycles, and operating temperatures, yet the data remains trapped within isolated hardware memory. Without unified network connectivity, maintenance leads cannot compare baseline performance across disparate stations. Structured industrial IoT dashboard development resolves this fragmentation by establishing reliable data links that pipe isolated controller registers into an accessible operational layer.
The Lag of Post-Failure Audits Versus Live Equipment Monitoring
When telemetry stays siloed, plant technicians only review controller logs after an equipment breakdown halts active production lines. These retrospective audits explain why a component failed, but they cannot recover lost shift capacity or prevent cascading mechanical strain. Deploying modern factory production monitoring software replaces post-mortem reviews with continuous data streams, exposing gradual temperature drift and anomalous run-times before operational disruption occurs.
What Is at Stake When Machine State Visibility Is Restricted to Local Logs?
Compounding Downtime from Unmonitored Temperature Spikes and Run-Time Drift
Thermal degradation and motor friction rarely cause instant hardware failure; instead, heat accumulates across extended run cycles while local controller registers quietly log abnormal temperatures. Because no centralized alarms highlight this progressive stress, machinery operates under elevated strain until physical components seize. Introducing factory production monitoring software enables maintenance teams to detect thermal drift and duty-cycle anomalies early, isolating mechanical friction before catastrophic stoppages occur.
Operational Blind Spots for Plant Supervisors Across Active Production Shifts
During routine shift handovers, plant supervisors lack aggregate visibility into cumulative equipment strain across separate assembly units. Without custom manufacturing analytics consolidating raw machine states into shift-level benchmarks, operational leadership cannot pinpoint which units require urgent lubrication or pacing adjustments. This informational vacuum leaves daily schedules exposed to unexpected bottlenecks that quickly propagate into downstream packing and finishing operations.
System Architecture: How Do You Design a Resilient Ingestion Pipeline for Industrial IoT Telemetry?
Edge Polling and Resilient Time-Series Ingestion Architecture
An industrial telemetry pipeline must withstand harsh network conditions across physical manufacturing plants. Rather than streaming raw sensor readings directly from sensitive controller units over fragile wireless links, lightweight edge gateways poll hardware registers over isolated industrial protocols. These edge nodes persist telemetry records in local storage buffers during intermittent network dropouts, reliably replaying backlogged events once central connectivity recovers. This architecture protects against dropped frames and provides an unbroken foundation for time series data visualization.
Structuring Real-Time Threshold Rules and Shift Efficiency Analytics
Once ingested into the central message broker, telemetry streams pass through stateless processing workers that continuously evaluate incoming measurements against configurable operational boundaries. If operating temperatures surpass preset safe margins or run-time duty cycles deviate from expected baselines, the system dispatches immediate notifications. Simultaneously, background aggregation jobs compile running shift totals, transforming raw sensor values into custom manufacturing analytics that track production velocity and equipment utilization.
Browser-Based Interface Design for Fast-Paced Shop Floor Environments
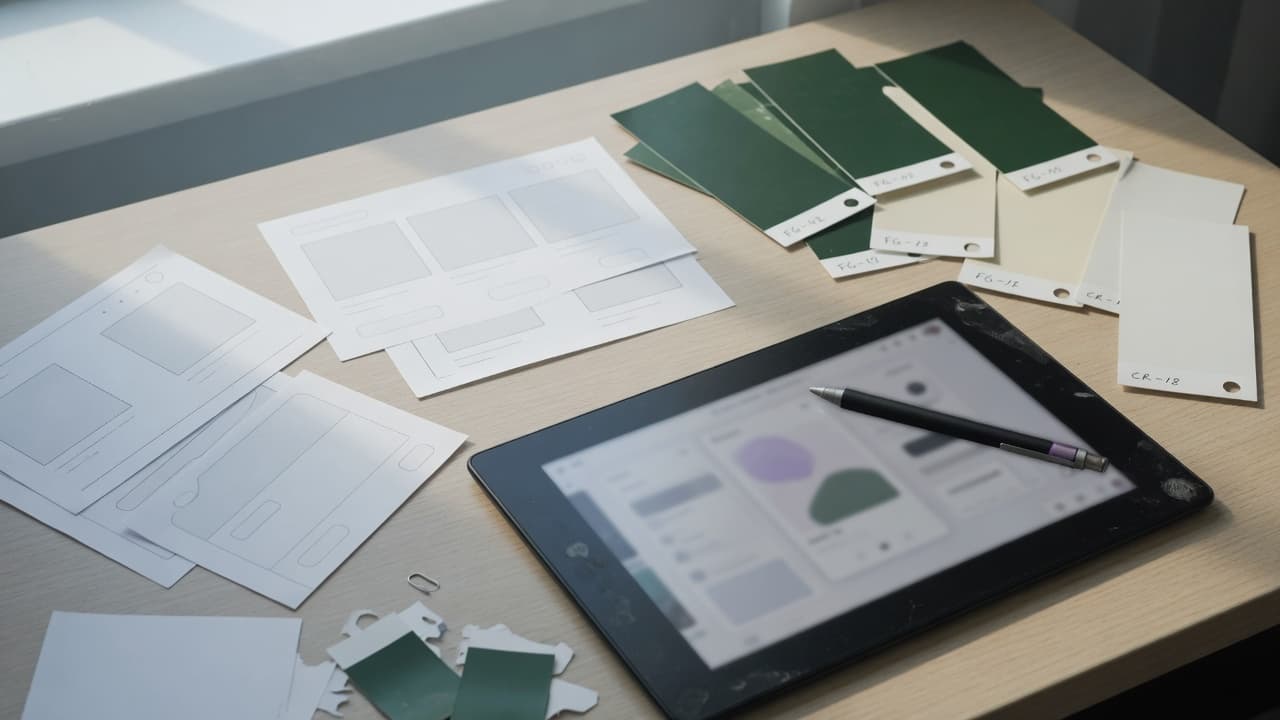
Factory supervisors and reliability engineers need clean, high-contrast dashboards designed for rapid interpretation on tablet screens and shared floor monitors. Modern web interfaces replace bloated proprietary desktop software with reactive browser clients that stream live machine states over persistent WebSocket connections. Operators can monitor active assembly cells at a glance, inspect historical thermal trends, and isolate stressed hardware without disrupting ongoing production workflows.
Implementation & Assurance: Where Does AI Speed Up Delivery, and Where Is Human Engineering Non-Negotiable?
Accelerating Dashboard Boilerplate and Data Visualizations with AI Coding Agents
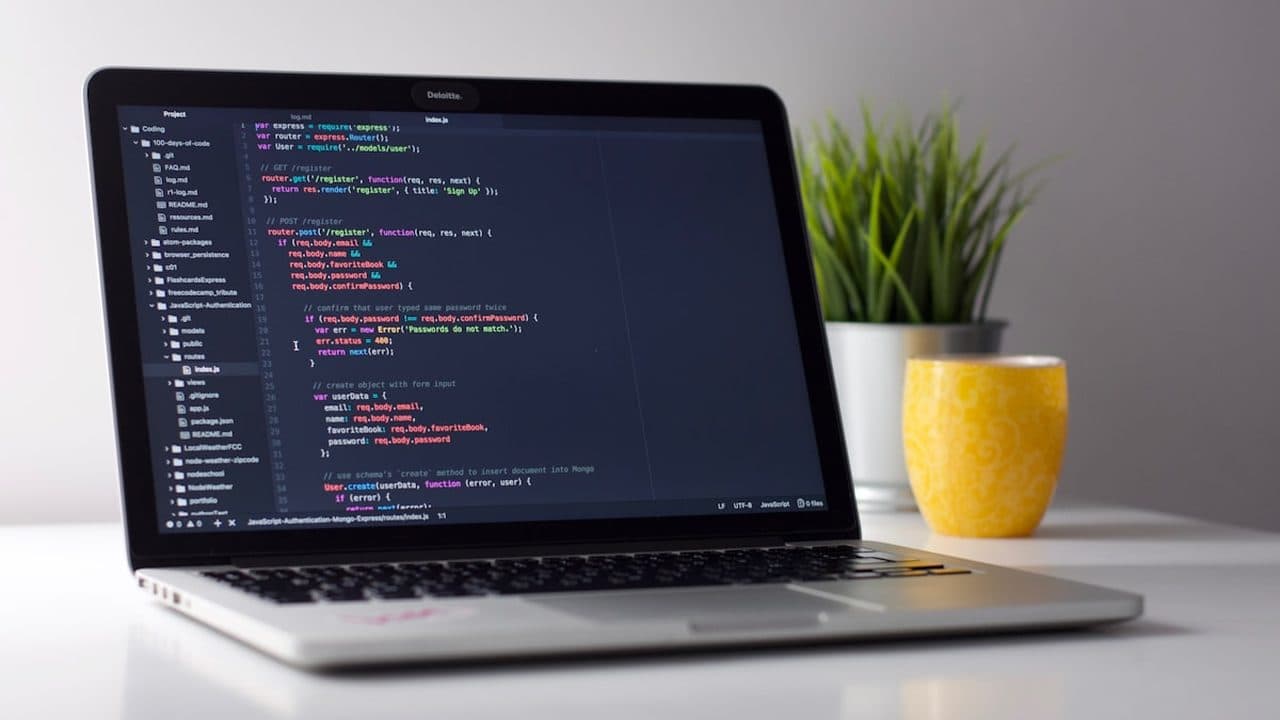
Modern software engineering teams leverage AI coding agents directed by senior developers to accelerate the initial phases of industrial IoT dashboard development. Generative tools excel at generating repetitive frontend boilerplate, drafting complex charting configurations, structuring REST and WebSocket endpoints, and converting schema definitions into responsive UI components. By delegating boilerplate assembly to AI agents within a structured engineering harness, teams dramatically compress early development cycles and rapidly prototype operational layouts.
Where AI Fails: Edge Protocol Edge Cases, Data Integrity, and Network Fault Tolerance
Despite substantial productivity gains in boilerplate tasks, AI models routinely struggle with industrial communication nuances, non-deterministic socket disconnects, and low-level data integrity constraints. Automated agents often overlook subtle byte-ordering quirks in serial controller protocols, fail to design robust disk-backed buffering for network dropouts, or generate naive ingestion queries that falter under concurrent write spikes. Without rigorous inspection, automated code introduces latent data race conditions and silent telemetry loss across active factory shifts.
Senior Engineering Ownership: Architecture Validation, Security Boundaries, and QA Releases
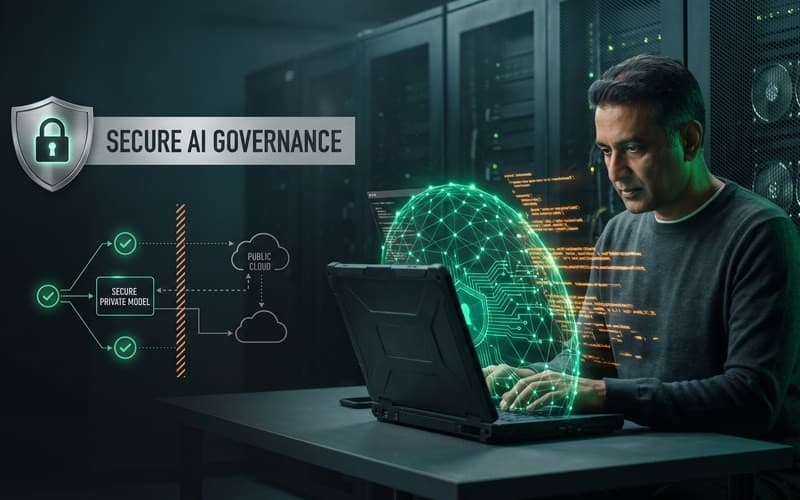
To ensure high operational resilience, experienced software engineers own system architecture, enforce secure perimeter boundaries, and review every pull request prior to deployment. Senior engineers validate failover logic, audit hardware authentication credentials, and configure end-to-end integration test suites that simulate severe shop floor network turbulence. This human-directed oversight guarantees that manufacturing telemetry dashboard software delivers enterprise-grade reliability and maintains airtight operational isolation across physical factory floors.
Operational Outcomes: How Does Centralized Telemetry Change Daily Factory Decisions?
Moving from Post-Failure Incident Triage to Live Threshold Monitoring
Transitioning from retroactive maintenance logs to real time machine telemetry transforms daily plant operations. Instead of dispatching technicians only after mechanical friction stalls an active assembly station, teams receive immediate notifications whenever equipment operating temperatures cross predefined safety limits. This automated early warning allows maintenance staff to inspect or lubricate bearings during scheduled changeovers, preventing sudden line disruptions.
Empowering Shift Supervisors with Unified Line Health and Runtime Visibility
Deploying centralized factory production monitoring software equips floor supervisors with a consolidated operational overview across active shifts. Plant leadership can assess cumulative run-time metrics, identify pacing bottlenecks between interconnected stations, and coordinate shift handovers with verifiable equipment health data rather than anecdotal operator logs. This consistent transparency aligns maintenance schedules with actual machine usage across the facility.
Strategic Takeaways: What Should Operations Leaders Evaluate Before Building an Internal IoT Dashboard?
Key Scoping Priorities: Ingestion Reliability, Security, and Scalable Visualizations
Before commissioning custom manufacturing telemetry dashboard software, engineering leaders must evaluate core technical fundamentals. Prioritise edge ingestion resilience over surface widgets; telemetry is only as reliable as local buffering during network outages. In addition, enforce strict network segmentation between industrial controllers and web tiers, ensuring time-series storage scales cleanly alongside sensor volumes.
Next Steps: Scoping a Business Systems Assessment with Canvas Developers
Translating factory telemetry into actionable custom manufacturing analytics requires disciplined architecture and experienced engineering oversight. Canvas Developers partners with industrial teams to architect, build, and harden robust operational software, guiding projects from technical scoping through agreed milestones and rigorous QA. To evaluate your facility's telemetry requirements, reach out via the contact form at https://www.canvasdevelopers.com/contact or WhatsApp on our website.